The Science Behind 3D Motion Capture in Football: IMU Sensors Explained
Key takeaways
- IMUs combine accelerometers and gyroscopes to capture foot motion data.
- Higher sampling rates like high-rate capture full strike motion profiles accurately.
- ML models classify raw IMU data into events like shots, passes and sprints.
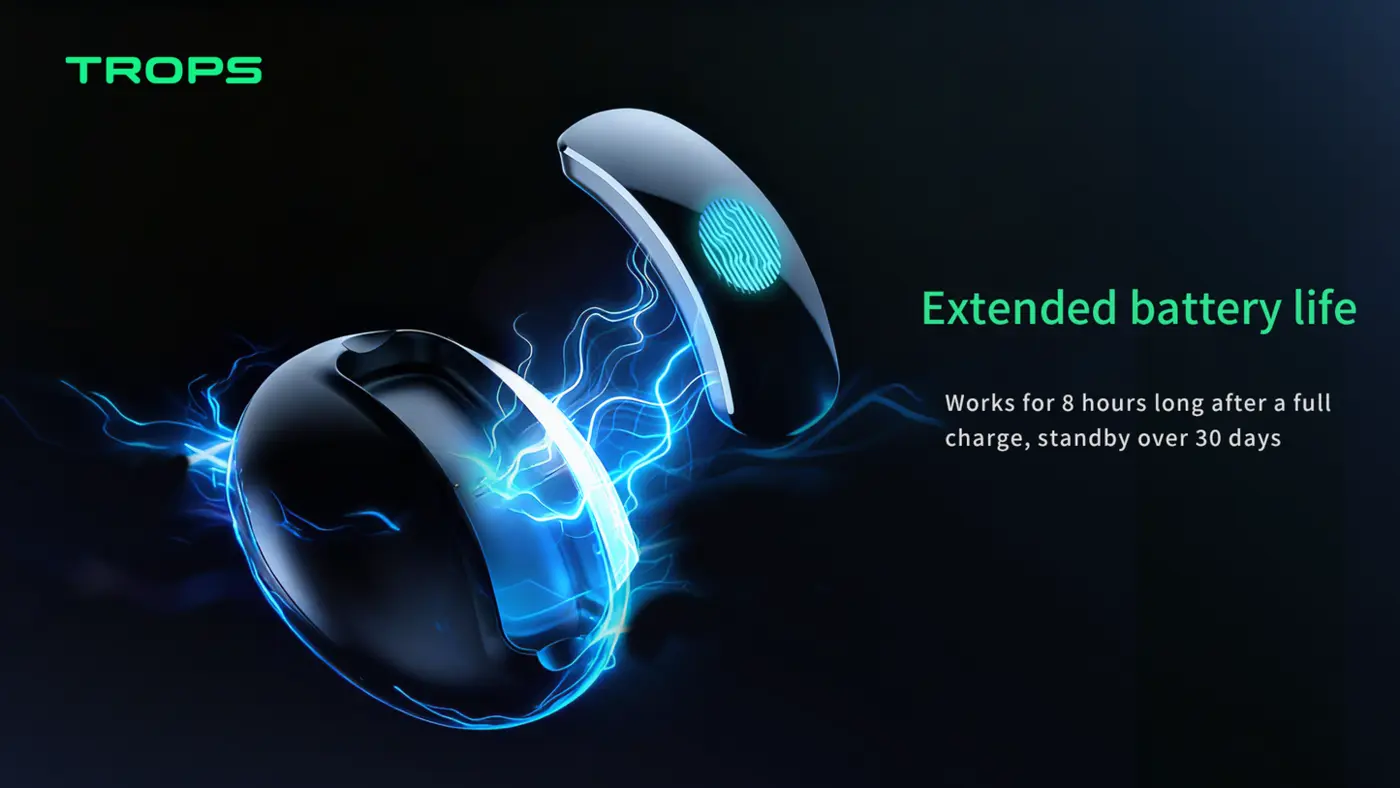
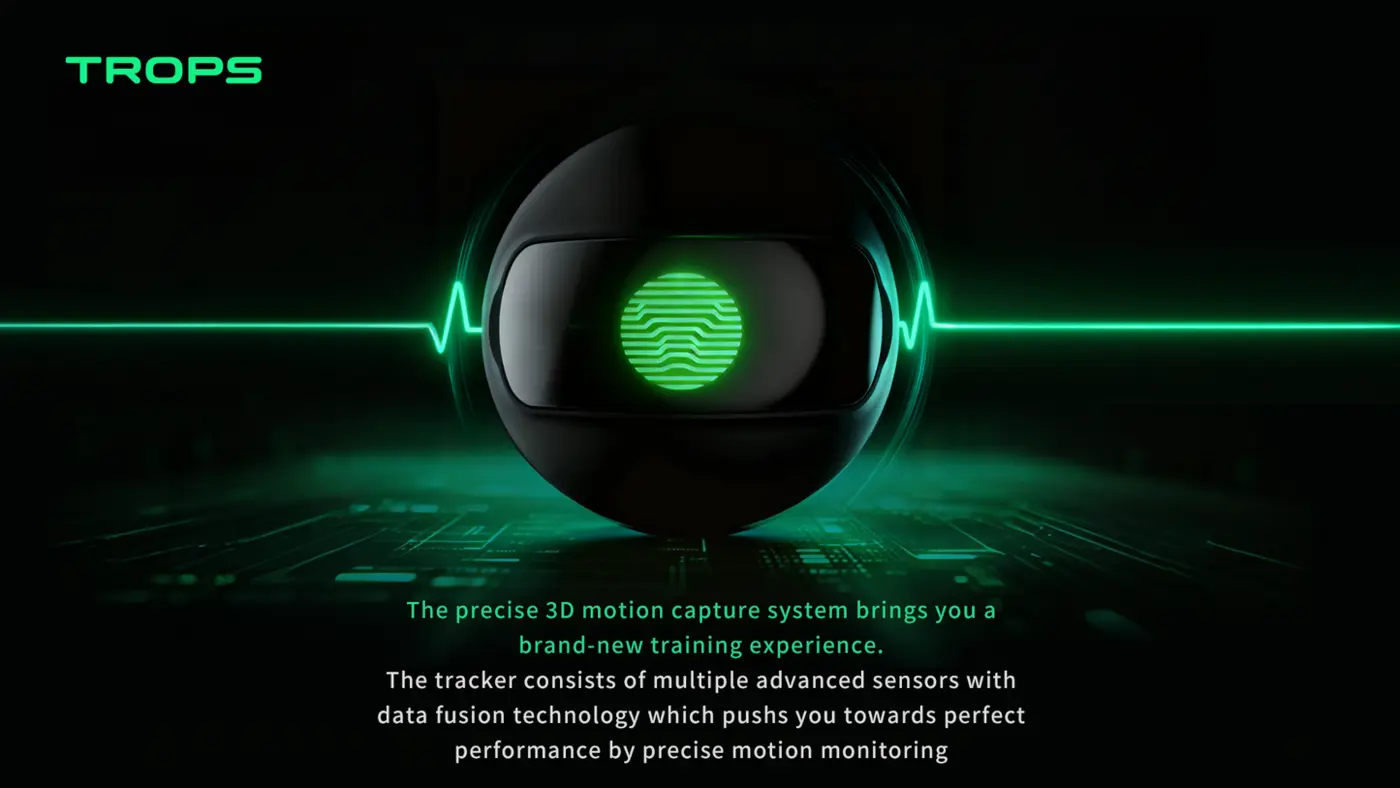
Every wearable football tracker contains an IMU — an inertial measurement unit combining accelerometers and gyroscopes. Here’s what that means in practice, and why it matters to the people who plan training sessions, run academies, or supply equipment to clubs and schools.
An IMU does not see the pitch. It feels the foot. From that single stream of motion data, a well-built system can reconstruct touches, shots, strike quality, left/right balance, sprints, distance and training load. Understanding the basics helps you judge a supplier, brief your coaches, and set realistic expectations with players and parents.
Accelerometers Measure Change in Velocity
They detect acceleration along three axes. Kicking, sprinting and changing direction all produce distinctive acceleration signatures.
In a foot-worn sensor, the accelerometer is the primary source for detecting events. A touch is a short, sharp spike. A sprint build-up is a longer ramp. A hard stop is a deceleration peak followed by a settling period. Because the sensor sits on the foot rather than the torso, these signatures are closely tied to ball contact and stride mechanics — which is why foot-worn units can report touches and strike quality that a chest-worn GPS pod cannot.
What coaches should look for
Ask suppliers how they handle orientation. A sensor can be mounted slightly differently from player to player, and the software must normalise for that. Ask whether the accelerometer range is wide enough to capture powerful strikes without clipping. And ask how the system separates a genuine ball touch from a studs-on-grass event or a stumble — this is where sensor quality and model training both matter.
Gyroscopes Measure Rotation
They capture angular velocity — how fast the foot rotates during a shot or a step. Combine both and you get full 3D motion.
Rotation is the difference between “the foot moved fast” and “the foot swung through a striking arc.” Gyroscope data helps distinguish a side-foot pass from a driven instep shot, and it supports left/right foot balance reporting because the swing pattern differs between feet. Combined with acceleration, it gives the six-axis picture that the TROPS-1’s 9-axis IMU records at high-rate.
A practical example
Two players each record 20 strikes in a session. One has a high proportion of clean, repeatable swing patterns; the other shows inconsistent rotation and lower strike quality scores. Neither number tells you what to coach on its own — but together they give you a starting point for a technical session, and a way to check whether the work you did last week changed anything.
Why Sampling Rate Matters
A shot lasts a fraction of a second. Higher sampling rates (high-rate = 1,000 readings per second) capture the full motion profile, enabling accurate shot detection and quality scoring.
At lower rates, the peak of a strike can fall between readings. You still detect that something happened, but the shape of the motion — the part that tells you about quality — is flattened. For sprint and distance metrics, lower rates are often adequate. For contact events at the foot, they are not. This is one of the clearest questions to ask when comparing devices; our comparison of GPS, IMU and optical tracking covers the trade-offs in more detail.
Checklist: questions to ask about any football wearable
- What is the IMU sampling rate, and is it constant or adaptive?
- Where is the sensor worn — sock, shin guard, vest — and does placement affect accuracy?
- How is data transferred (Bluetooth 5.0 on the TROPS-1) and how often?
- What is the battery life under real training conditions (up to 8 h on a battery cell)?
- What is the ingress rating (IP66 on the TROPS-1) and what does the warranty cover?
- Which metrics are measured directly and which are modelled?
- Can you export raw or per-event data, or only summary reports?
How AI Turns Motion Into Metrics
Raw IMU data is noisy. Machine-learning models trained on labeled football actions detect patterns — shot, pass, sprint, stop — and classify them automatically. That is how the platform can tell you a player took 23 shots, 9 with the left foot, at an average quality score of 82.
The practical consequence is that two suppliers using similar hardware can produce very different reports. The model, the labelled training data and the post-processing rules do much of the work. When you evaluate a system, look at whether the event counts match what you saw on video. A simple test: film a short session, count touches and shots manually, then compare. If the numbers diverge badly, the classification layer needs scrutiny.
Common mistakes when adopting motion data
- Treating scores as verdicts. Strike quality is a training signal, not a selection decision.
- Changing too many variables at once. If you alter session design, sensor placement and drills in the same week, you cannot attribute the change.
- Ignoring context. A session on a heavy pitch in cold weather is not comparable to a dry summer session.
- Skipping the baseline. Two to three weeks of normal training before you draw conclusions gives you something to compare against.
- Over-reporting to players. Share a small number of metrics that connect to what you are coaching.
Putting IMU Data to Work: A Rollout Sequence
Step 1 — Define the question
Decide what you want to know before you buy. Examples: are we loading players evenly between left and right foot? Do our sprint exposures match the demands of match week? Are technical sessions producing measurable changes in strike consistency? Different questions need different reports, and the Team Platform is built around per-player and per-team views with trends and video sync.
Step 2 — Standardise the setup
Agree sensor placement, warm-up routine and session logging. Consistency beats sophistication. A simple protocol applied every week will outperform an elaborate one applied occasionally.
Step 3 — Run a baseline period
Collect two to three weeks of normal training. Note attendance, pitch conditions and session type alongside the data so you can interpret it later.
Step 4 — Review weekly, act monthly
Weekly reviews catch anomalies — a player whose load spikes, a session that produced far fewer touches than intended. Monthly reviews are where you look for trends and adjust the programme. Our guide to building a data-driven training programme walks through a workable meeting rhythm.
Step 5 — Connect data to coaching
Pick one or two metrics per block and tie them to a drill. If left/right balance is the focus, design sessions that force weak-foot contacts and check the ratio afterwards. If sprint exposure is the focus, review top speed and sprint counts against your plan.
Practical Scenarios
Academies
Foot-worn IMUs are useful where technical development is the priority, because touches and strike quality are captured at the point of contact. The Academy Bundle pairs sensors with the platform and onboarding for squads of 10 to 100+ players, which suits academies standardising across age groups. See how one youth academy approached technical development in our case example.
Schools and PE programmes
In school settings, the value is engagement and consistency rather than deep performance analysis. Simple, visible metrics — touches, sprints, distance — work well with students, and IP66 hardware survives typical school use. Our notes on school football programmes cover practical safeguarding and logistics considerations.
Clubs and distributors
Clubs should pilot before scaling: a small group, a defined question, a fixed review date. Distributors should confirm MOQ terms early — samples from 10 units, OEM from 100 units — and check certification (certification documentation) and app compatibility (iOS and Android) before committing. The supplier selection guide sets out the questions worth asking.
What IMU Data Does Not Do
It does not replace watching players. It does not predict injury, and it should never be presented as doing so. It does not remove the need for good session design. What it does is give you a consistent record of what happened on the pitch, so that conversations with players, parents and coaching staff rest on evidence rather than memory.
If you are weighing up hardware, the buying guide and the FAQ cover the common sticking points, from battery life to data ownership.
Next Step
Want to see the metrics live? View the TROPS-1 or request a sample. Our team can walk you through sensor placement, sampling rate and reporting for your specific setting — academies, schools, clubs or distribution.
Recommended for your program
Frequently asked questions
What is an IMU and what does it actually measure in a football tracker?
An IMU is an inertial measurement unit combining accelerometers and gyroscopes. Accelerometers detect acceleration along three axes, capturing events like touches, sprints and stops. Gyroscopes capture angular velocity, showing how fast the foot rotates during shots or steps. Together they provide a six-axis 3D motion picture of foot movement.
Why does sampling rate matter when comparing football wearables?
A shot lasts a fraction of a second. At high-rate (1,000 readings per second), the full motion profile is captured, enabling accurate shot detection and quality scoring. At lower rates, the peak of a strike can fall between readings, flattening the motion shape that tells you about quality. Lower rates are often adequate for sprint and distance metrics.
How can I check whether a system's event detection is accurate?
Film a short session, count touches and shots manually, then compare with the system's numbers. If the counts diverge badly, the classification layer needs scrutiny. Two suppliers using similar hardware can produce very different reports because the machine-learning model, labelled training data and post-processing rules do much of the work.
What common mistakes should we avoid when adopting motion data?
Avoid treating scores as verdicts — strike quality is a training signal, not a selection decision. Don't change session design, sensor placement and drills in the same week, or you can't attribute the change. Ignoring context like pitch and weather, skipping a two-to-three week baseline, and over-reporting to players are also common pitfalls.
Need help choosing the right equipment?
Talk to Our Export TeamRelated Reading
What Is a Soccer Foot Tracker and How Does It Improve Youth Training?
A practical guide to soccer foot trackers: how IMU sensors measure shots, sprints and foot balance, and how academies use the data in daily training.
Read →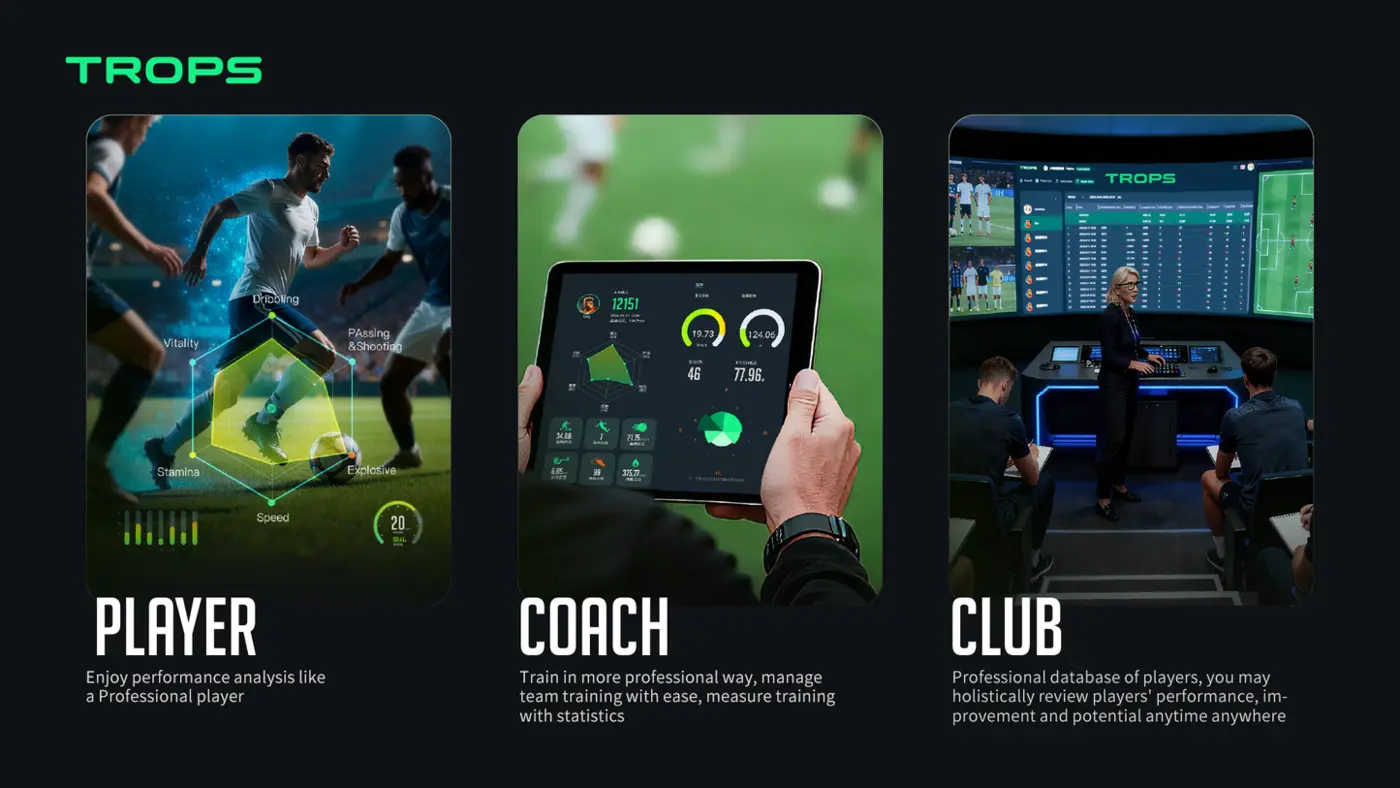
How Wearable Sensors Help Football Academies Develop Players Faster
How football academies use wearable sensors to give objective technical feedback, manage load and fatigue, communicate with parents, and scale player development across squads.
Read →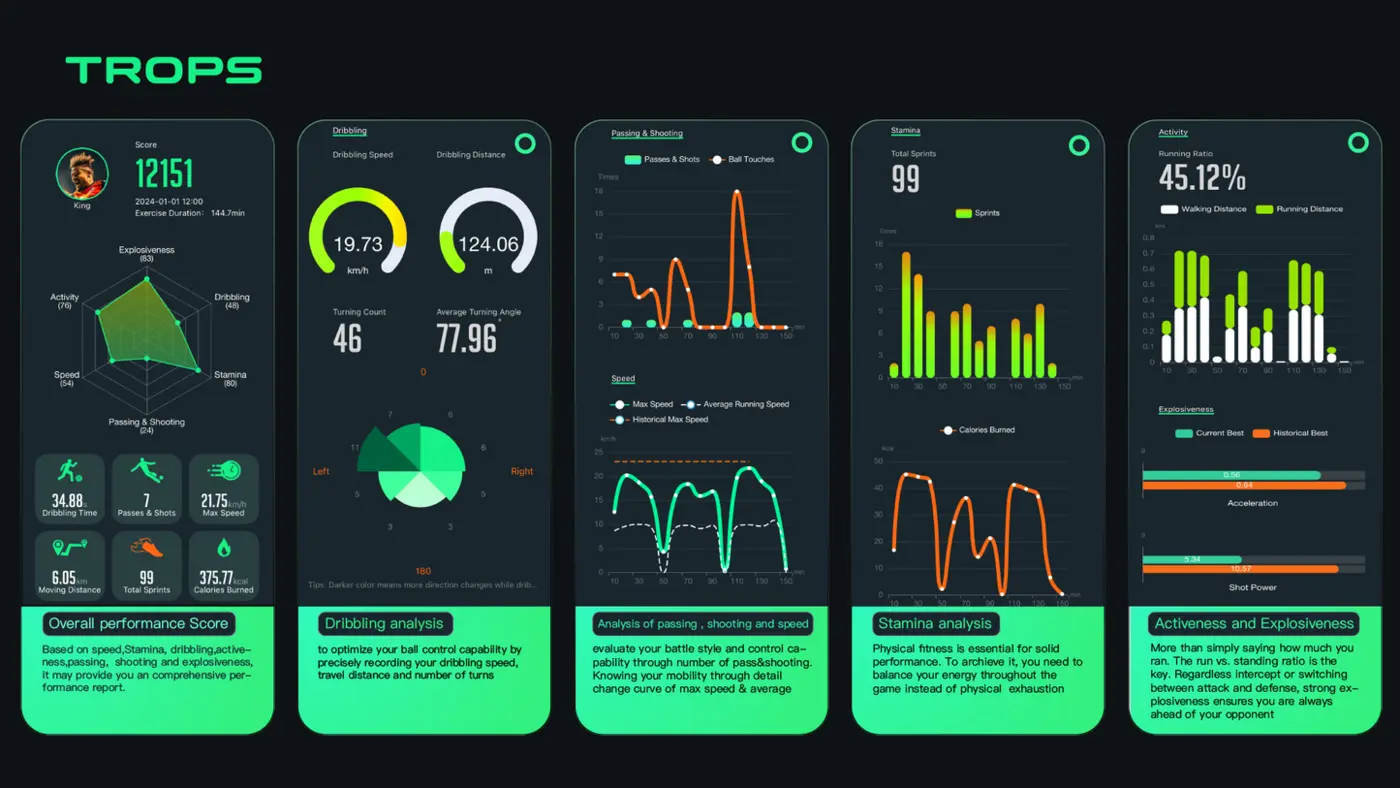
Buying Guide: What to Look for in Football Data Tracking Equipment
A practical buying guide for academies, schools, clubs and distributors comparing football data tracking wearables — accuracy, battery, durability, software, MOQ and support.
Read →